by Miles Hecker
All images and text unless otherwise indicated‚© 2000-2002 WyoFOTO LLC
![]()
Written by photographic educatorMiles Hecker, with contribution byNorman Koren, this important essay provides‚ possibly for the first time‚ a mathematical analysis of the basis for digital camera image quality.
A word of caution;‚ to fully appreciate what Miles and Norman have come up with requires wading though some math. Nothing terribly complex, but a bit of concentration is required. For the mathematically challenged youareallowed to skip to the summary and conclusions, but do try and derivesomeunderstanding of how these conclusions have been arrived at.
When I first read a draft of this article I was struck by how closely the resultant analysis matches the subjective impressions that I had when first testing theCanon D30in 2000, and then theCanon D60in early 2002. In both instances I was regaled online by some who found my opinions and analysis to be contrary to the waytheywanted the world to be. Though many photographers have subsequently substantiated my conclusions, it’s nice to have them confirmed by objective analysis.
‚ Michael
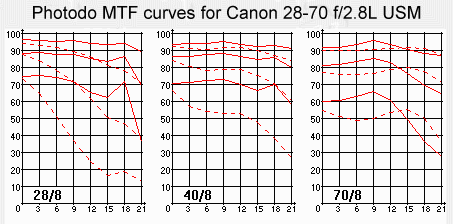
One of the most difficult tasks facing the photographer about to buy his or her first digital camera is the issue of image quality, or IQ as I call it. No other hi-tech field has done as poorly in defining the basic qualities of the products they sell as the electronic camera industry. The hi-fi stereo industry has a bevy of meaningful specs that the prospective buyer can use to judge the relative merits of an amplifier or set of speakers that are candidates for purchase. While not perfect, these numbers give one a place to start. The prospective buyer of a serious pro lens can look at MTFmodulation transfer functioncharts made available by many makers to look at. For the initiated these provide meaningful information about lens contrast and sharpness under varying conditions. The digital camera industry normally issues one statistic, the number of megapixels the sensor captures‚ about as meaningful as the maximum possible speed indicated on your cars speedometer. But we may now have a better way to describe image quality.


Koren’s Hypothesis
At the roots of the electronic communications industry is Claude Shannon’s ideas on information theory. His classic equation defining the transmission capacity C of a data channel is,
C = W log2(SNR+1)
C the data capacity is usually measured in bits per second. The photographic equivalent is image detail. This includes both the actual numbers of pixels you see in an image and their quality or tonality. A color image has more information than a B&W image and as such requires more capacity to capture and display.
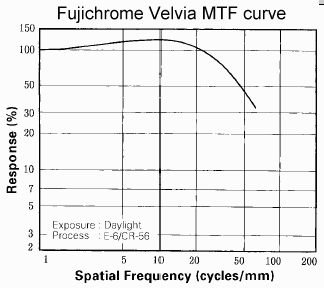
W is the bandwidth of the channel in hertz. This corresponds closely to the optical 50% MTF frequency f50. The higher the MTF 50, the higher the perceived image sharpness. Lenses, electronic image sensors, film and even printers have their ownMTF characteristics.
SNR is the signal-to-noise ratio . Film grain is the film equivalent of electronic noise. SNR is difficult to measure in the world of film photography. Kodak uses a system it calls print grain index to measure grain. The SNR of a photo depends on the overall range of luminosity in an area of the photo and the size and luminosity range of the grain in that area. SNR is highest, in contrasty detailed areas, like those seen in the B&W MTF curve you see on the left. It is lowest, and hence noise/grain is most visible, in smooth areas like the cloudless blue skies of a desert landscape image.
Astudy of scanned imagesby R.N. Clarke has shown that if MTF was the only factor effecting image quality it would take about 12 megapixels for a digital camera to equal 35mm photos shot with a fine grain modern film. However noise/grain effects the overall quality and plays an important role. These relationships led my friendNorman Korento make the following conjecture which I call Koren’s hypothesis.
IQ = W log2(SNR+1)
Perceived image quality, IQ is proportional to total information capacity, which is a function of both W , which is the image visual capacity in one dimension (sharpness) and noise (grain).
W = MTF 50 * sensor size
W is the product of MTF 50 and image sensor size . MTF 50 is measured in line pairs/mm and the sensor or film size is measured in mm. If the image is recorded on film, the film size replaces the size of the sensor. MTF 50 can be calculated for the camera system by using a combination of lens data, sensor or film data, and a computer based mathematical model. SNR depends on the luminosity range of the pixels in the image, usually 256:1 for 8 bits per color RGB pixels and the noise/grain as measured in the image.
The image quality of digital cameras will equal 35mm with fewer pixels than predicted by MTF alone because digital cameras with large sensors‚ all the pro-level SLR’s‚ have much less noise.
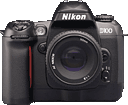
Skies in these digital camera images are virtually grainless. That makes a big difference in perceived quality. Many photographers will perceive images from the current generation of high-end 6 megapixel cameras‚the Canon EOS D60 and the Nikon D100‚ to be equal to 35mm. We are there now! On the other hand digital cameras with very small sensors‚the point and shoot variety‚ have significant noise, even if they have the same number of pixels.
 A Monument Valley Landscape
The MTF 50 image sharpness calculations for the camera systems were performed byNorman Koren.Norman used manufacturers lens and film MTF data and established models for CCD and CMOS sensors to perform his calculations. The data was fed into his Mathworks basedcamera system modelon his PC. The model depends on both the film or sensor type and the height of the film or sensor exposed to create the image. The computer model calculates the image sharpness MTF 50 number in line pairs per millimeter. W the overall image optical bandwidth can then be calculated by multiplying the MTF 50 number by the sensor height in mm. Sensor or film height data was as specified by the manufacturer and not actually measured.
The SNR was calculated by me from actual digital images loaded into Adobe Photoshop. I used film images shot by myself and scanned on a NIkon LS8000 scanner at 4000 DPI for the Provia 100F and Velvia SNR numbers. Digital images from theDigital Photography Reviewtests of the Nikon D100, Canon D30 and D60 were used for noise measurements of those cameras. The noise measurements for the Sony F707 were taken from pictures I’ve shot with an actual camera I have.
I selected and cropped out a 50×50 pixel test patch of clear uniform blue sky with the Photoshop crop tool. The Image / Histogram tool was then used to create a Histogram of the test patch. I tried to select an area that is roughly of zone 6 luminosity (light grey if you’re unfamiliar with thezone system). The standard deviation of the luminosity channel is the noise RMS value. An ideal test section of uniform color should have a deviation of zero. The same section sampled by an analog/digital converter should have a standard deviation of 0.5. The A/D converters used will always have rounding or quantatization error of + or – 1/2 the least significant bit. The maximum value the signal can have for an 8 bit per color image is 255. The range of signal spans 256 values from 0 to 255.
Based on these factors, that maximum SNR value possible for a standard 24 bit digital image is 256/0.5 or 512. Some digital cameras came very close to this number. The Canon D60 was best with a SNR of 345.The Nikon D100 followed very closely with a SNR of 308. I used patches of blue for two reasons. One, I am a landscape photographer and the quality of blue skies is very important to me. The second is most image sensors tend to have more noise in the blue channel.

 Clear blue Velvia sky
The Results
4.2
38.5
19.1
284
5996
0.68
*The 1DS numbers are based on DPreview and LL sample 1DS images. The 14N are guestimates based on SNR vs pixel size for similar CMOS sensors.
Bottom line, straight out of the camera, both of these produce images which beat 35mm Provia 100F scans with no PS magic. They should produce superb 13"x19" prints. At this size they even give 645 MF stiff competition. Although I think a little PS work on areas such as skies should get the MF tonality to be more in line with the 1DS tones.‚ Miles
 Sony F707
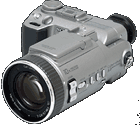
The hype surrounding the introduction of a typical digital camera is amazing. The new 5 megapixel Sony F707 was supposed to put to shame the lowly 3 megapixel Canon D30. Experienced digital camera users know pixel size isn’t everything. Pixel quality matters a great deal. Generally speaking, bigger pixels are better pixels because they have more signal and less noise. The real world output of the D30 usually beats the the Sony F707 hands down. I’ve printed shots from both and can vouch for this. The reason is simple, it has a much better SNR. Why you ask? The Sony pixels are much, much smaller. Smaller pixels have less area to gather light. Less light means less signal. For a given semiconductor process, the noise stays the same regardless of pixel size and the signal increases with pixel size. The only way to fix this is to cool the image sensor or go to a different semiconductor process. Many pro digital backs found on medium format cameras use Peltier active coolers. Yes, they hang a small refrigerator on your camera! For a cost of $12,000-$20,000 they’ve got to give you something. Astronomers cool their CCD sensors with liquid nitrogen to image faint stars. Not a good solution for the average photographer!
As mentioned before the results show that the newest digital SLR’s have gotten to the point where they equal scanned 35mm film in image quality. The D60 and D100 have a normalized IQ of 0.78 and 0.76 respectively. A 35mm Provia 100F frame has a normalized IQ of 0.84, Velvia is 0.73. The digital cameras enjoy the advantage of a built-in digital signal processor that your roll of film doesn’t have. Photoshop does give this advantage if you’re an advanced user or wizard. You can mask off the sky, and hit it with a smart blur or Gaussian blur. This will give you an enhanced film image. In the chart above the enhanced film images for Provia 100F and Velvia are noted by a + sign. Film benefits far more from this technique than the larger image sensors. You can perform similar magic with D60 and D100 images but the gain is small. They are already almost noise free.
I find that with my traditional 35mm favorite film, Provia 100F and perfect technique I can create a digital print of about 12.5"x18" that is of very high quality. It compares very favorably with a traditional wet darkroom 645 print. Most people when viewing the image think it was taken with a medium format 645 camera. A normalized IQ of 1.0 therefore means a very high quality print on a 13"x19" sheet of paper is possible. An IQ rating of about 0.73-0.78 would indicate about an 10.7"x16" high quality print is possible on an 11"x17" sheet of paper. A D30 shot without interpolation trickery will yield a very nice 9"x13" print. It’s IQ is 0.54. This is not a perfect system. A photo with a small amount of intricate detail taken with a D60 or D100 will go much bigger and hold up. A portrait is a perfect example of this. But, if you need high detail and very good tonality both, the numbers seem valid. The Sony F707 is capable of being printed to about an 8"x11" print before its images start deteriorating. Its IQ is 0.41. A 645 image shot with Velvia or Provia 100F and handled properly can yield a superb 24"x30" print. A good medium format negative still beats the current crop of digital SLR’s. That will change in the coming years. The table below shows the relationship between IQ and high quality print size. To me, a high quality image shows excellent detail and sharpness even when examined at a very close viewing distance. Image quality degrades slowly as you exceed the listed size. Loss of detail and tonal deterioration, the blocking up of subtle color transitions becomes more and more obvious. Film images seem to show the poor tonality first. Digital images show the lack of fine detail first.
High Quality Print Size Table
| Normalized Image IQ | Approximate print Size in inches | Print area in square inches |
| 1.75 | 24×30 | 720 |
| 1.0 | 13×19 | 247 |
| 0.85 | 12×16 | 192 |
| 0.75 | 11×15 | 165 |
| 0.55 | 9×13 | 117 |
| 0.40 | 8×11 | 90 |

Photo Courtesy Foveon Corp.
Foveons new image sensor
The Normalized Image Quality numbers provided by Koren’s hypothesis can provide a quantitative indication of overall digital image quality. These numbers work equally well for images scanned from film or acquired from a digital camera. Since they correlate well with subjective evaluation of images made by human eyes, they provide a real alternative to simple megapixel counts.
The model is open ended and can be extended to include new sensors such as theFoveon X3sensor and the Fuji honeycombsuper CCDsensor.
Norman Korenlives in Colorado, where he is writing a book on fine digital printmaking. He recently left a 32 year career in magnetic recording technology/data storage. He has been involved with photography since 1964.
Miles Hecker has for 26 years taught photography and electronic imaging atCasper Collegelocated in Casper, Wyoming.
Mr. Hecker is co-founder of WyoFoto. a web site dedicated to Wyoming and Rocky Mt. landscape and nature photography.
There are a number of related tutorials and reviews on this site that you may find of interest. These include…
